Designing a Benchmark We Could Return To
A benchmark is only useful if future measurements are comparable to the baseline.
I designed the study around a consistent set of measures, player segments, survey distribution, and scoring conventions so future waves could answer a simple question:
Did the player experience actually improve?
I also documented sample composition and methodological limitations so changes in the scores could be interpreted in context rather than treated as standalone numbers.
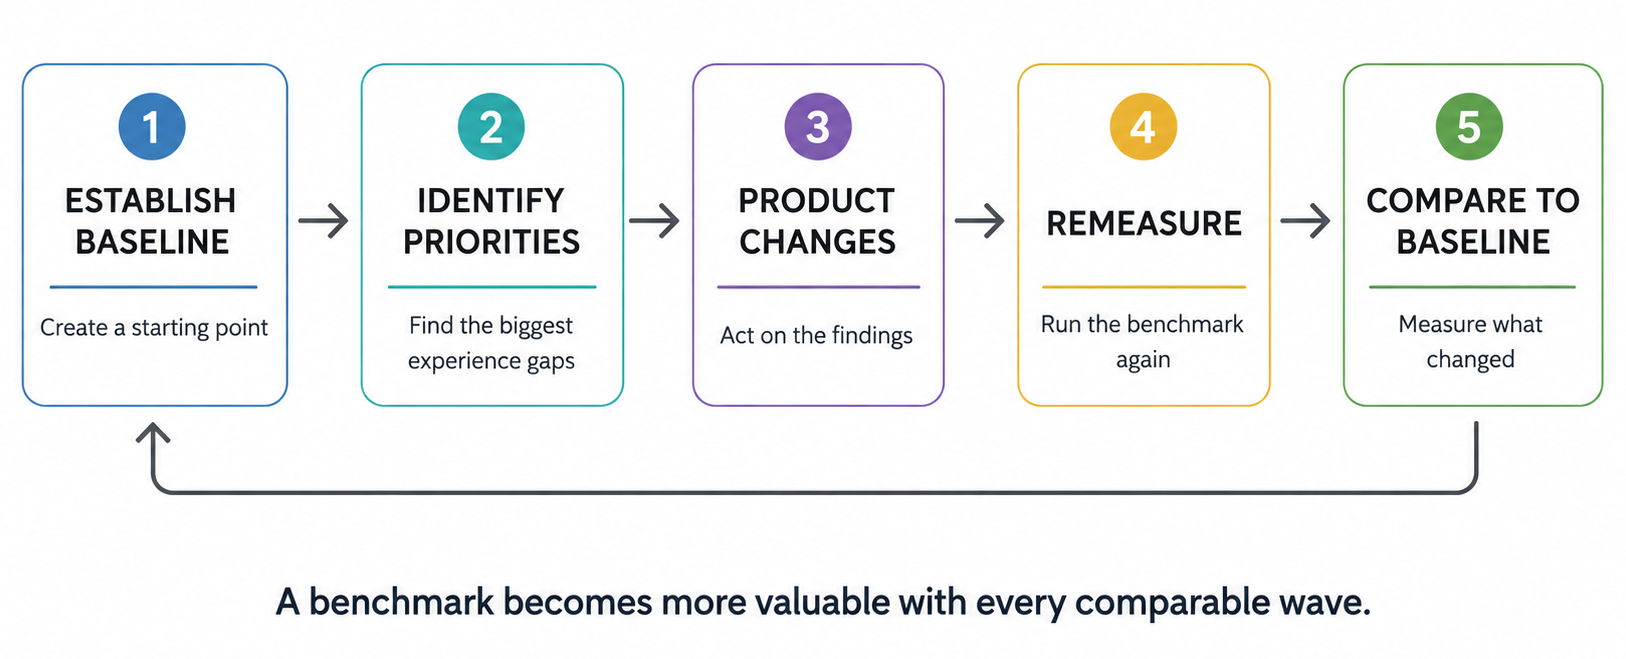
The intention was to repeat the measurement after meaningful product changes and compare future player sentiment against the same starting point.
Methodology
I ran two parallel in-app benchmarking surveys for General Population and VIP players during the same fielding window, distributed through the Gold Fish Casino app inbox using SurveyMonkey.
The study combined CSAT, an 8-item SUPR-Q-based UX measure, and NPS, with 36,000+ General Population responses and 821+ VIP responses. Each measure was analyzed separately and then compared across player segments to identify where experience strengths and risks diverged.
Because this was designed as a longitudinal benchmark, I kept the player segments, distribution approach, measures, and scoring conventions consistent so future waves could be compared against the same baseline.
Why Three Measures?
No single metric could explain the entire player experience.
CSAT helped identify satisfaction with specific parts of the product — including overall experience, game variety, purchases, support, rewards, and ease of use.
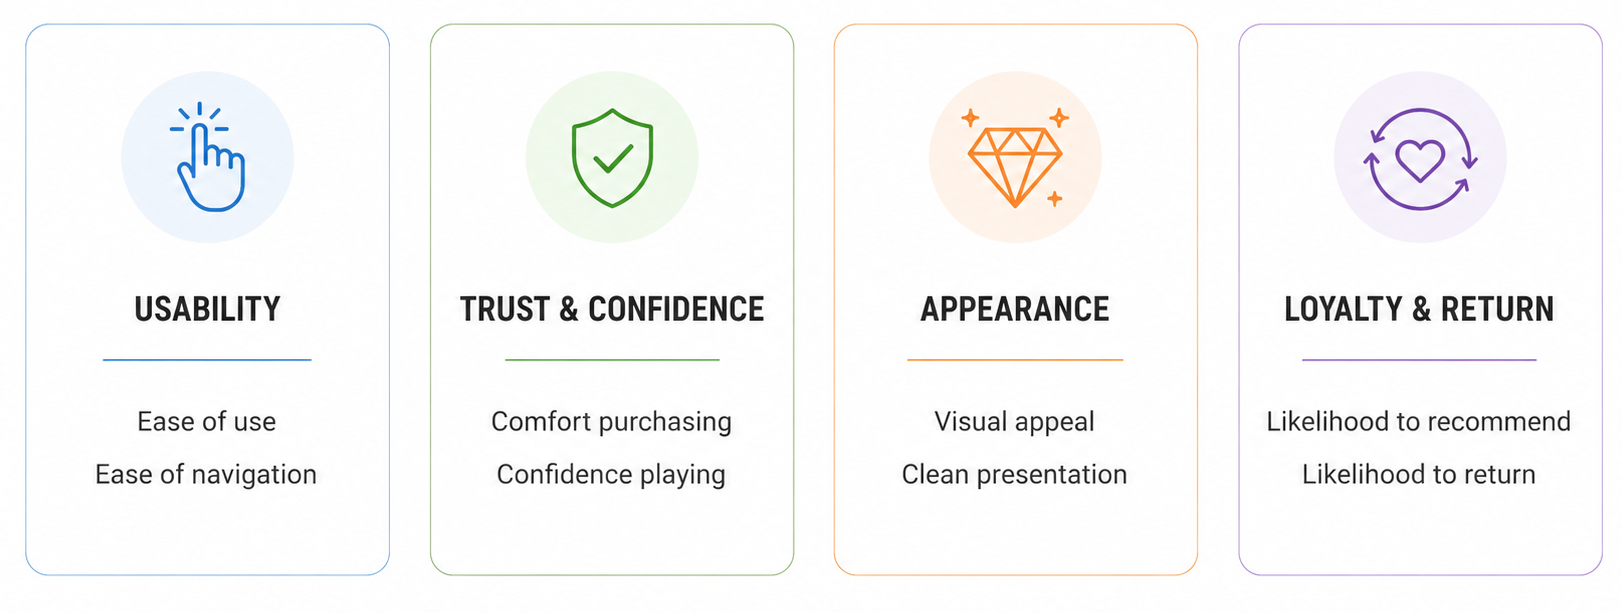
SUPR-Q provided the framework for examining broader perceptions of the experience across usability, trust and confidence, appearance, and loyalty.
NPS established a separate advocacy baseline that could be tracked alongside those experience measures.
Looking at the measures together helped reveal an important distinction:
A product can be easy to use without necessarily feeling valuable enough to recommend.
What the SUPR-Q-Based Measure Helped Us Examine
Rather than relying on a single overall UX score, I looked across the individual experience dimensions to understand where perception was strong and where it began to weaken.
USABILITY
Ease of use
Ease of navigation
TRUST & CONFIDENCE
Comfort purchasing
Confidence playing
APPEARANCE
Visual appeal
Clean and simple presentation
LOYALTY & RETURN
Likelihood to recommend
Likelihood to return
FINDING 01
Usability Was a Strength, Not the Main Problem
Ease of use emerged as one of the strongest parts of the experience.
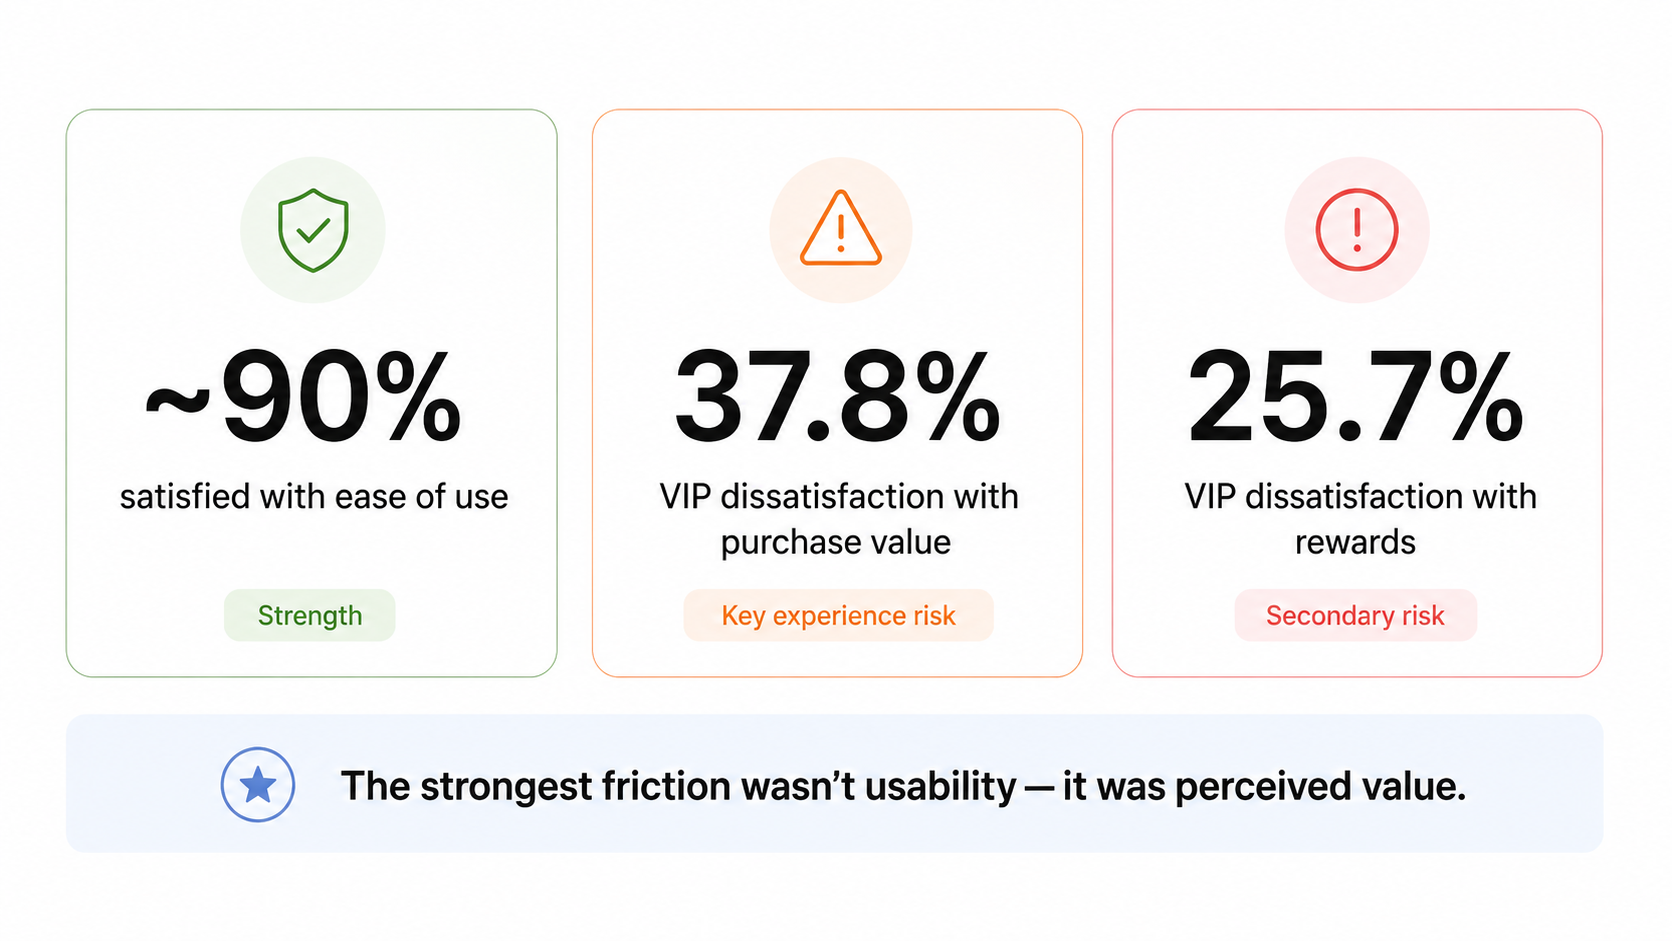
Among VIP players, 87.09% were satisfied or very satisfied with ease of use. Among the General Population, that number reached 90.24%.
The SUPR-Q responses reinforced the same pattern. Roughly nine in ten players across both groups agreed that the app was easy to use and easy to navigate.
That gave the team an important signal:
Lower scores elsewhere did not point to broad usability as the primary experience problem.
Ease of use was a strength to protect, not the main problem to solve.
FINDING 02
The Value Gap Was Largest Among VIP Players
The clearest segment difference appeared when players evaluated what they were getting in return for spending.
Among VIP players, 37.82% were dissatisfied or very dissatisfied with the value of their purchases, compared with just 9.49% of the General Population.
Rewards showed the same pattern. 25.72% of VIP players were dissatisfied with rewards and bonuses, compared with 13.87% of General Population players.
That changed how I interpreted the broader experience.
The segment most invested in the product was also more critical of the value it received in return.
The opportunity was not:
“Make the product easier.”
It was:
“Make the experience feel more worthwhile.”
FINDING 03
Advocacy Lagged Behind the Rest of the Experience
NPS added a different lens to the benchmark.
The General Population established an NPS baseline of 0, while VIP players were approximately -2.
I did not treat those scores as a diagnosis on their own. What mattered was how they compared with the rest of the experience data.
Players could rate the product highly for ease of use and navigation while being much less enthusiastic about recommending it.
Viewed alongside the purchase-value and rewards findings, that exposed an important gap:
Strong usability was not automatically translating into strong advocacy.
That helped shift the conversation from isolated UX issues toward the broader relationship between perceived value, loyalty, and recommendation.
The Segment Gap Became the Story
Looking across the benchmark, VIP players consistently evaluated several parts of the experience more critically than the broader population.
The biggest differences appeared around purchase value, rewards, overall satisfaction, and advocacy.
That mattered because treating the player base as one audience would have hidden one of the study’s most important signals:
The players most invested in the product also had the highest expectations of what they received in return.
The benchmark therefore became more than a scorecard. It helped identify where experience priorities differed by player value segment and where a single product strategy might not be enough.
What the Research Changed
The benchmark changed the conversation from:
“Are players satisfied?”
to:
“Where are we strong, where are we vulnerable, and which player groups need something different?”
The findings gave the team a clearer set of priorities:
Protect usability.
Ease of use was already a strength across both player groups, so a broad usability redesign was not the priority. Both segments rated ease of use highly.
Focus on perceived value.
Purchase value and rewards emerged as much bigger experience risks — particularly for VIP players. VIP dissatisfaction was substantially higher for both purchase value and rewards.
Respond differently to VIP expectations.
The segment differences suggested an opportunity to make the value and rewards experience more relevant to high-value players rather than assuming one approach would work equally well for everyone. The original analysis specifically called out more personalized offerings for VIPs.
Track loyalty over time.
Rather than reacting to one NPS score, the benchmark created a starting point for evaluating whether future changes moved satisfaction, experience quality, and advocacy.
The research turned three metrics into a clearer product-prioritization story.
Impact
The value of this work was not a single redesign or one “good” score.
It gave the team a consistent baseline for measuring player experience that could be revisited after future product changes.
The study:
Established a baseline across satisfaction, UX quality, and advocacy
Created separate benchmarks for General Population and VIP players
Identified purchase value and rewards as key experience risks, while showing that usability was already a strength
Created a repeatable measurement framework for tracking whether player perception improved over time
The benchmarking program was designed to support future comparison, trend tracking, product prioritization, and resource allocation as the experience evolved.
The biggest impact was giving the organization a shared starting point for understanding the player experience — and a consistent way to measure whether it was getting better.
What I Was Careful Not to Overclaim
A large response volume made the benchmark useful, but sample size alone did not remove every limitation.
Because the surveys were distributed through the in-app inbox, participation was self-selected, and the General Population sample was substantially larger than the VIP sample.
I treated the results as a strong attitudinal baseline, while documenting differences in sample representation and the limitations of each metric.
I also avoided treating NPS as a diagnosis on its own. It showed how willing players were to recommend the product, but not necessarily why they gave that score.
The benchmark was designed to identify patterns and establish a starting point — not turn every score into a causal explanation.
What I’d Measure Next
The value of a benchmark grows when the same measures are repeated after meaningful product changes.
For the next wave, I would keep the core measures, player segments, and fielding approach consistent so movement could be compared against the original baseline. That was the intent of the benchmarking program from the beginning.
I would focus on three questions:
Did the problem areas improve?
Track whether satisfaction with purchase value and rewards moves after changes targeted at those experiences.
What is driving advocacy?
Pair NPS with a short qualitative follow-up so promoters and detractors can explain why they gave their score. The original study explicitly recognized that NPS alone does not provide that reasoning.
Are the VIP and General Population gaps closing?
Continue comparing the two groups to understand whether changes improve the experience broadly or affect one player segment differently.
The goal of the next wave would not be simply to make the scores go up — it would be to understand what changed, for whom, and whether the experience was actually improving.
Takeaway
Benchmarking gave the team more than a set of scores. It created a shared starting point for understanding the player experience and a repeatable way to measure whether it was improving over time.
The study also revealed an important distinction: Gold Fish Casino was easy to use, but usability alone was not enough to create a strong sense of value — especially among VIP players.
The strongest benchmark is not the one with the highest scores. It is the one that helps a team understand what to protect, what to improve, and whether those changes actually worked.